Faster sequential reads?

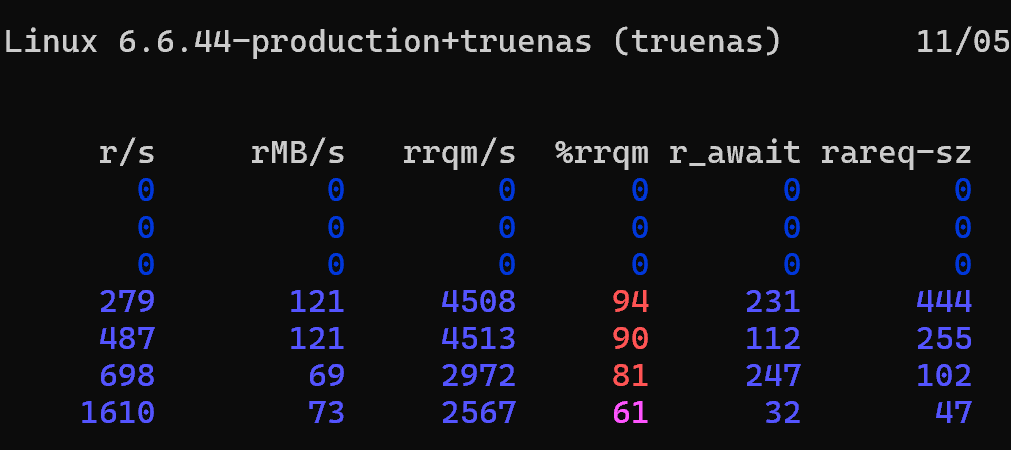
Here’s a snapshot of iostat during a scrub of my rustpool:

4x SATA drives in two mirror vdevs.

The numbers jump around a bit but I’m seeing rMB/s remain over 100 per drive for many minutes at a time. As depicted here the sum is 608MB/s and it’s exactly what I expect from this pool. To me it suggests no bottleneck on the storage side.


Here’s a long sequential read from this pool using a Windows host connected via 2x 10Gb iSCSI. At this point the file has been read multiple times and is fully cached in ARC:

To me this is close enough to the network’s “line rate” and it suggests no artificial bottleneck at the client or in the networking aspect.


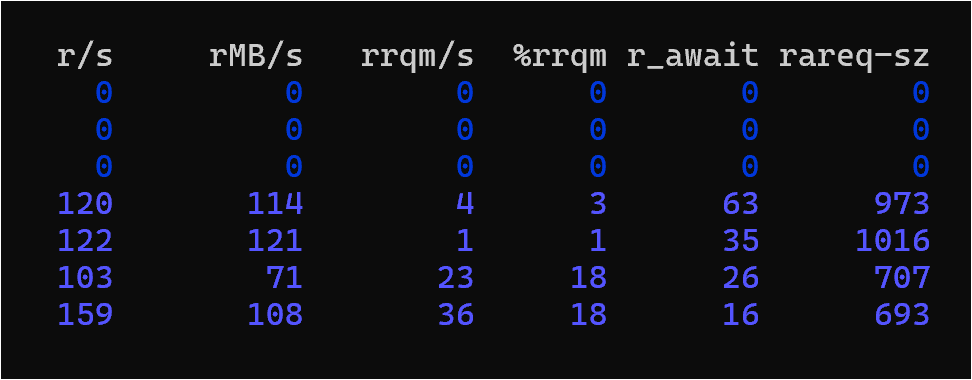
Here is a “not cached in ARC yet” read of this same file @ 1M blocksize from the Windows client:

Each disk periodically goes to 100 %util – often in pairs – but they never remain there for more than 1-2 sample periods (2-4s in my case). The sum of rMB/s is 380MB/s – a far cry from the 608MB/s scrub throughput. Why?

Client throughput is even worse:

Less than half what the pool is capable of.

fio on the client returns numbers similar to DiskSPD.

fio on the ZFS host reading a test file at the root of this pool is somewhere in-between (about 400MB/s).

In the beginning I had recordsize=256k pool-wide and volblocksize=64k on this volume. I’ve since went to 1M records then re-created the zvol @ 128k (max volblocksize) – this helped a little. The client filesystem (NTFS) has been tried with both 64k and 1M clusters to no real effect.

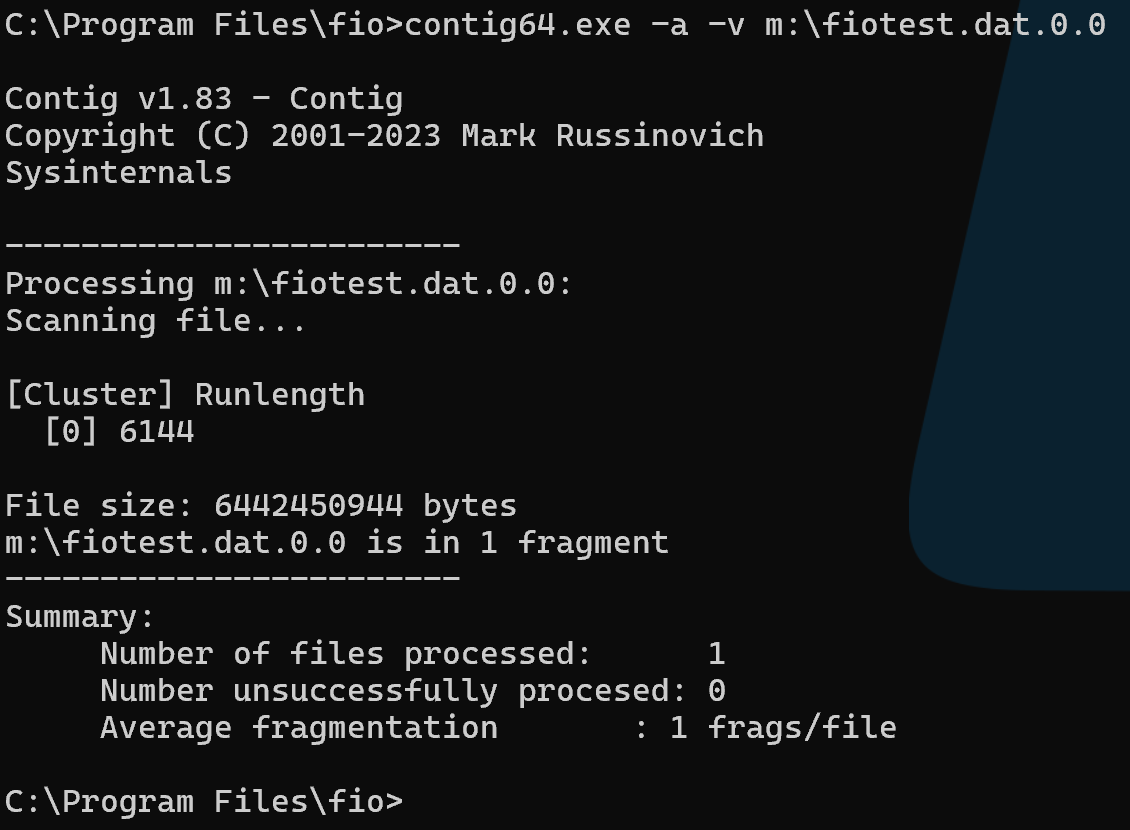
No fragmentation at the NTFS level:


In the iostat output I notice read IOPs (r/s) at the drive level often seem excessive for what should be a smaller number of big block reads.

My ZVOLs are sparse/thin and I strive to ensure UNMAP/TRIM is enabled and functional at every layer. So I’m wondering…

Is it reasonable to expect large block sequential reads to approach the sum of the drives max sustained throughput, and if so, how does one get there?
Scrub on zfs mirror is sequential so it’s as fast as possible. Reading data isn’t as sequential as scrub as data blocks are spreaded through the cow layout where it find’s a place. With bigger recordsize (eg 1M) you observe little better bandwidth but it will hurt you even more for directory listing and find cmd’s as metadata performance will go much more down as you win for throughput, so be aware of that and test yourself.

You haven’t really described the environment very thoroughly, but it sounds like you’re seeing the result of SMB being bursty and weird. ZFS isn’t going to fetch blocks from the zvol more quickly than SMB is requesting them in the first place.

So you’re essentially squaring latencies: when there’s a latency in the requests coming in over the wire, you then tack on the latency of the rust drives, which in turn makes it more likely that SMB will inject MORE latency as it waits for the stalled blocks before requesting more.

Another factor, when you’re talking about 10Gbps throughput: you can VERY easily bottleneck on CPU, because a single SMB network connection must be handled by a single CPU thread. You might very well discover that multiple concurrent network requests WILL saturate both storage and network throughput, while a single network thread just plain won’t. You can check for this by looking for 100% CPU utilization on INDIVIDUAL CPU cores while one of your slower-than-you’d-like tests is running.

Final note: comparing scrubs to a single file request is very much apples vs oranges. A scrub will always read simultaneously from both sides of a mirror vdev, but a single process read generally only reads from a single side of the vdev (there is a little wiggle room in this; MASSIVELY high io queue depth gets you a little more reading from both sides on a single process read, at the expense of massively increased latency on small I/O during busy periods).

Hi Jim, there’s no SMB here. It’s:

Windows iSCSI —> 10Gb x2 —> SCST —> zvol

I’ve been testing seq. reads at Q8 T1 with 256k and 1M blocksizes (no difference there). You’re suggesting T2 would close the gap? I can bench this later this afternoon.

Higher latency on small I/O would be acceptable if I could get these seq. reads done faster. You refer to a high queue depth at what layer, the client’s iSCSI initiator? ZFS? Or the Linux block layer? Let me know which knob you’re referring to and I’ll twist it for science.

I’ve just realized my iSCSI client has been sitting at 32 because I was diagnosing a different problem months ago and forgot to restore the default (256 I believe). I’ll give 256 a go later today.

Here’s the rub: these reads are fast as hell when all the blocks are sitting in cached within ARC/L2ARC. ARC hit reads occur at “line rate” (~2.2GB/s) and L2ARC reads are almost as fast (likely SSD crappiness holding it back a little).

I reckon I need to back out of the weeds and ask the real question: What setup would saturate the spindles on seq. reads? How would you construct this?

Yes I am.

All the way up and down the stack, essentially. There isn’t anything to twist on the ZFS layer to increase queue depth; ZFS is basically just answering the ops as they come in.

edit: I take that back; you can adjust max queue depth at the OpenZFS level using kernel tunables zfs_vdev_queue_depth_pct and zfs_vdev_async_write_max_active. With that said, this is not something I have ever needed to adjust, nor do I advise casually adjusting it. This is the kind of deep magic that you can easily find yourself on the wrong side of, when you narrowly adjust looking for one specific number that makes you happy, get that number, then either wonder why or simply don’t notice that your ACTUAL seat-of-the-pants performance got distinctly worse!

So essentially “increased queue depth” in real world (as opposed to benchmarking) terms comes down to building the application to make heavily parallelized requests (which is obviously not always an option, for those consuming or administering rather than developing) rather than serial requests, then making sure nothing between it and storage takes those parallelized requests apart and serializes them unnecessarily.

Good! But you’re still going to have to deal with latency issues, when the top of the stack (your Windows apps) is making serialized requests, and will only make the next batch when the current batch has completed. :slight_smile:

Did going to T2 help?

I’ve switched to running fio on the ZFS host which takes the client, the network, and SCST out of the picture.

No. I’ve played with readahead, tweaked more ZFS knobs, and cranked queue depths to the moon anywhere I can but nothing gets past the wall at 320-390MB/s when reading my zvol. Adding threads does nothing. Numjobs=2 creates the illusion of improvement but I suspect one job is reading content freshly cached via the other job having read the block first. iostat looks the same as always.

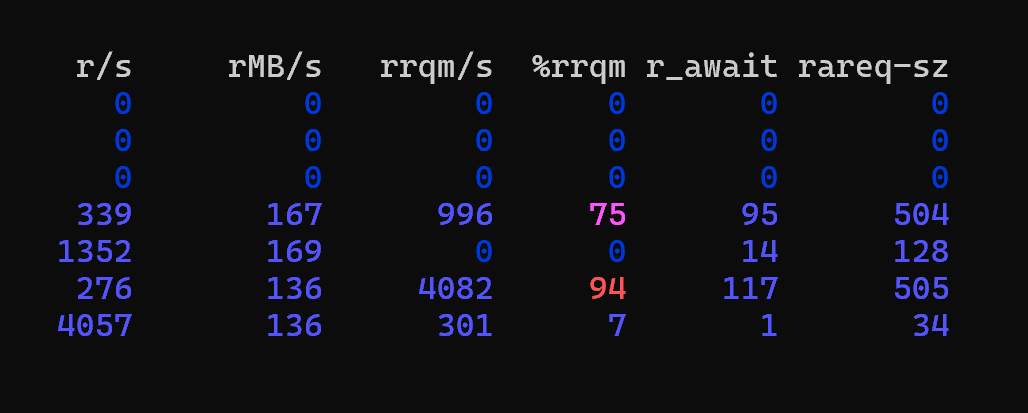
That said, with all the knobs I’ve turned my transfers are at the high-end of that range now:

Now I’m seeing 1M rareq-sz make it to the disks and rMB/s has more disks spending more time north of 100.

Raised:
zfs_vdev_sync_read_min_active
zfs_vdev_sync_read_max_active
zfs_vdev_async_read_min_active
zfs_vdev_async_read_max_active
zfs_vdev_aggregation_limit
zfs_vdev_read_gap_limit

Not one of these made any noticeable difference but collectively they move the needle a bit.

Well, there’s one last thing… Have you tried using filesystem datasets (potentially with raw file backing stores) instead of ZVOLs?

I have yet to benchmark ZVOLs and NOT be wildly disappointed.

Funny you mention that. I moved the whole circus over to an SMB share and my load times ranged from just a bit faster to perhaps 20% faster. So about what I’m seeing now (320-390MB/s with some runs in the high 200s). Also I got to play with the strange SMB multichannel animal which is rather alien to this block guy.

Bottom line it was a small win but I ditched it because client-side (Windows) SMB caching has the memory of a goddamn goldfish. I couldn’t find any knobs to make Windows cache SMB in the same manner as a block device.

One would think an SMB client can ask the server at any time if a file has changed since the initial read. But it seems after the file is closed both parties then walk away like it never happened.

Anyway I’ve set the pool’s recordsize to 2M, made a new zvol at max blocksize (128k), formatted it with 2M NTFS clusters, and re-populated it with these big files. I was careful to copy them in a serial fashion so as to not “interleave” the files with each other on-disk. Current read throughput at the client roughly matches what fio does running local on the host. It’s definitely performing better than when I first started.

One more tweak I forgot to mention is setting /sys/block/*/queue/scheduler to none which seems to mitigate most of the “outlier” slow samples during fio runs. I think the default was deadline.

Edit: This is interesting and relevant. I have mismatched drives in my pool.

Edit2: My head is spinning:

zfs_vdev_mirror_rotating_inc=0 (int)
         A number by which the balancing algorithm increments the load
         calculation for the purpose of selecting the least busy mirror
         member when an I/O operation immediately follows its predecessor
         on rotational vdevs for the purpose of making decisions based on
         load.

 zfs_vdev_mirror_rotating_seek_inc=5 (int)
         A number by which the balancing algorithm increments the load
         calculation for the purpose of selecting the least busy mirror
         member when an I/O operation lacks locality as defined by
         zfs_vdev_mirror_rotating_seek_offset.  Operations within this
         that are not immediately following the previous operation are
         incremented by half.

 zfs_vdev_mirror_rotating_seek_offset=1048576B (1MB) (int)
         The maximum distance for the last queued I/O operation in which
         the balancing algorithm considers an operation to have locality.
         See ZFS I/O SCHEDULER.

More knobs!

Edit3: --ioengine=io_uring consistently outperforms everything else. I presume benchmarking in this mode is relevant to zfs + SCST?

I’m consistently hitting 420-430MB/s w/ local fio.

zfs_vdev_mirror_rotating_inc > 0 was a bag of hurt until various max_actives had been lowered. Makes sense in light of:

zfs_vdev_max_active
The maximum number of I/Os active to each device. Ideally, zfs_vdev_max_active >= the sum of each queue’s max_active.

Once queued to the device, the ZFS I/O scheduler is no longer able to prioritize I/O operations. The underlying device drivers have their own scheduler and queue depth limits. Values larger than the device’s maximum queue depth can have the affect of increased latency as the I/Os are queued in the intervening device driver layers.

(emphasis mine)

A tank of pending I/Os likely neuters the zfs_vdev_mirror_rotating_* load-balancing algo as the throttling would take place too far upstream to accomplish anything useful. It just gets in the way.

So with zfs_vdev_mirror_rotating_[seek]_inc = 5 I started lowering read_min_actives and read_max_actives and the fio runs kept getting faster. Landed on:

zfs_vdev_async_read_max_active = 1
zfs_vdev_async_read_min_active = 1
zfs_vdev_sync_read_max_active = 1
zfs_vdev_sync_read_min_active = 1

At this point the “master” setting zfs_vdev_max_active doesn’t appear to matter.

zfs_vdev_read_gap_limit at default (32k) created a massive performance regression. I landed on 2M + a 128k buffer after contemplating the iSCSI client’s 2M NTFS allocation units – figured it should hopscotch over one cluster without breaking stride. Likewise for zfs_vdev_mirror_rotating_seek_offset and zfs_vdev_aggregation_limit. I’ll need to test from the client later and see if this matters.

zfetch_min_distance and zfetch_max_distance are back at their defaults. No real difference in my testing.