Monitoring linux Servers

Hi all,

I’m getting my feet wet monitoring some (atm 4) servers. They are in different geographic locations, all connected via wireguard and run Ubuntu. Their purpose is to provide me with backup targets in exchange for some useful services to the people paying for power, so friends and family colo.

I only need some rudimentary monitoring like hosts up and reachable, zpool status, remaining disk space… (if there are some other important/useful metrics to watch out for, I’m all ears).

I tried the nagios core version as a docker container but wasn’t able to get anything going. I’m not sure if this is for lack of trying or if their docs are meant to get you to go pro. At least to me it was confusing. Is there a trick I’m missing or does it just require more indepth learning/attention?

The second thing I tried is checkmk. This was (using the “raw” version) easier to get going and even gave me the zfs params I’m looking for without any additional config. But, monitoring 2 of the servers with ~40 params per server completely locked up my shitty celeron monitoring box. Additionally they don’t seem to have any monitoring app. If someone is using checkmk, how do you do alerting?

Are there any other good and prefably easy to set up selfhosted monitoring solutions? Or is 4 servers something you’d check manually? I’d guess that I’m likely not going to manage more than 8-10 machines in the long run. Also, I don’t want to become a monitoring expert, if I don’t have to :sweat_smile:

Thanks for any tips/feedback!

Cheers
D
1 Like

I’ve recently setup monitoring with Zabbix and found it to be simple to install and setup hosts for monitoring. For the inevitable questions, their forums have proven useful.

There are a great many options for receiving alerts, from email to the majority of chat apps. There are no first party apps on android or iOS, but there are a limited selection of third party apps. On Android I found Tabbix/Tabbix Pro to be the best user experience and ZBX Viewer the best for iOS (although the workflow to change between Zabbix servers on the latter is a little cumbersome, but probably irrelevant if you’re only running a single monitoring server).

4 Likes

Try librenms. It’s quite easy to set up. The docs explain how to set up snmpd on the targets to add more useful metrics.

Or you can use Prometheus to gather the data and grafana for a nifty dashboard. I find the learning curve of grafana quite challenging

3 Likes

I still use Nagios for this sort of thing. Frankly, I’m not aware of any other tools that can give me the info I want about my ZFS pools. I’ve used Zabbix, LibreNMS, Prometheus, etc., etc., and while they all work for a ton of metrics, I could never get basic info about ZFS pool health, updated snapshots, etc… They are all happy to give me 1000 ZFS metrics I don’t care about, just not the ones I do :slight_smile:

If it’s possible to do the core ZFS monitoring I need in another tool, I would make the swap. I use Nagios these days JUST for ZFS monitoring via Sanoid.

I am running Nagios on an AlmaLinux VM but it’ll be a Debian 12 VM in a week or so. If you’re not familiar with a tool like Nagios, etc., I find learning about that tool on a full VM a lot easier than trying to learn the tool and understand any changes or tweaks made to allow it to run in Docker.

Nagios takes a good bit of time to get rolling if you’ve never used it before, and beyond opting for the paid-for version, I’ve never had much luck with tools offering to make my configs for me, etc.

But, once you get it running and setup one server, adding more servers to be monitored is the work of moments.

:: Insert ye olde cliche about how once you know how it works, it’s easy… ::

1 Like

A thought occurs… you could just be lazy… :slight_smile:

You could setup a cron job to just do something basic. Have it pull the output of the nagios sanoid checks (which don’t actually need Nagios, they are just formatted for it). You could dump them into a file and have the system diff it and email you if it changes. Or, just send you a daily digest that you look over.

It’s not a durable as a monitoring solution, and includes relying on email, etc., but if you want something fast and dirty, there are options…

1 Like

I also found nagios intimidating so I setup monitoring with telegraf.

I posted a write up here and it includes info on how to integrate sanoid health checks. If you encounter any issues reach out and I’ll to try help/publish fixes.

2 Likes

I’m in a somewhat similar situation: home server with ZFS and a bunch of media related services running, mostly for friends and family. I also use the server as a backup of my Google Drive data and photos, and push periodic snapshots to a remote server with ZFS.

Aside from the usual cronjobs to scrub my local and backup pools, I do a few extra things:

I’m using https://habilis.net/cronic to make sure I don’t mess up the email notification part of the cronjob. It’s a simple wrapper script that sends an email in a readable format if a cronjob fails.

I use Sanoid to create snapshots on my home server, and use Syncoid to push those to a cloud VPS with a beefy network drive as an off-site backup. Both tools are available here: https://github.com/jimsalterjrs/sanoid

The free tier of https://cronitor.io makes sure I’m alerted if a cronjob fails, or fails to run on time. Especially that last bit is interesting: that way I’m sure cronjobs aren’t silently failing for days/weeks on end.

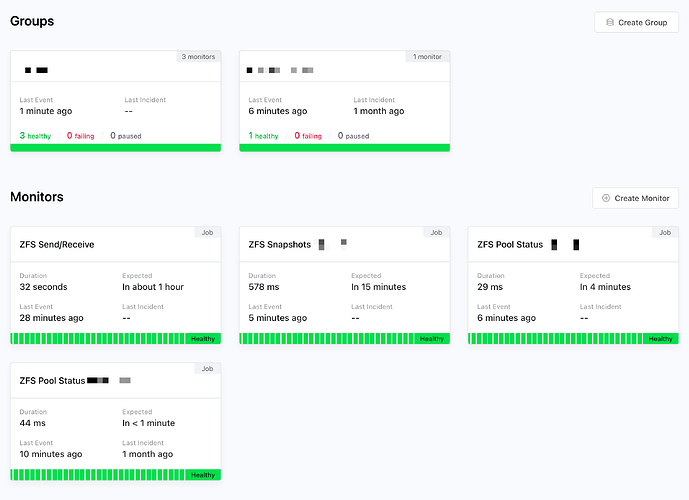
I have 4 monitors set up in Cronitor: snapshot creation, zpool status on the local and backup machine, and send/receive with Syncoid. This is how that looks on the Cronitor dashboard:

This is the “ZFS Pool Status” script:

#!/bin/bash

set -euo pipefail

exit_code=0

/sbin/zpool status -x | grep -v "all pools are healthy" && exit_code=1

exit $exit_code

This script is called with a timer by Systemd, via this zpool-status.service:

[Unit]
Description=Checks zpool status

[Service]
Type=oneshot
ExecStart=/usr/local/bin/runitor -uuid SECRET -- /root/zpool-status.sh

You could also set up something like https://github.com/pdf/zfs_exporter for Prometheus, create a Grafana dashboard with relevant metrics, and create alerts there. That would allow you to alert on more in-depth things like pool performance, storage usage, etc.

Let me know if you need more info, happy to help or share more example!

(Sorry for the link formatting, apparently I can only add two links to a post as a “new user”…)

2 Likes