Slow sync writes with 3xmirror

Hello,

I am getting about 180 MBps when transferring a 5.8GB file over nfs. I do have an SLOG device. The recordsize is set to 1M.

Is this expected?

# zpool iostat tank -l 5 -v
                                                       capacity     operations     bandwidth    total_wait     disk_wait    syncq_wait    asyncq_wait  scrub   trim  rebuild
pool                                                 alloc   free   read  write   read  write   read  write   read  write   read  write   read  write   wait   wait   wait
---------------------------------------------------  -----  -----  -----  -----  -----  -----  -----  -----  -----  -----  -----  -----  -----  -----  -----  -----  -----
tank                                                 5.39T  49.2T      0  2.38K      0   539M      -   25ms      -    1ms      -    1us      -  134ms      -      -      -
  mirror-0                                           1.87T  16.3T      0    144      0   111M      -  128ms      -    6ms      -  600ns      -  126ms      -      -      -
    ata-WDC_WD201KFGX-68BKJN0                            -      -      0     72      0  55.5M      -  147ms      -    7ms      -  576ns      -  149ms      -      -      -
    ata-WDC_WD201KFGX-68BKJN0                            -      -      0     72      0  55.5M      -  110ms      -    5ms      -  624ns      -  103ms      -      -      -
  mirror-1                                           1.78T  16.4T      0    148      0   115M      -  122ms      -    7ms      -  720ns      -  118ms      -      -      -
    ata-ST20000NM007D-3DJ103                             -      -      0     75      0  58.8M      -  121ms      -    6ms      -  864ns      -  113ms      -      -      -
    ata-ST20000NM007D-3DJ103                             -      -      0     73      0  56.6M      -  123ms      -    7ms      -  576ns      -  122ms      -      -      -
  mirror-2                                           1.74T  16.4T      0    144      0   111M      -  165ms      -    6ms      -  600ns      -  158ms      -      -      -
    ata-ST20000NM007D-3DJ103                             -      -      0     71      0  54.5M      -  141ms      -    6ms      -  528ns      -  130ms      -      -      -
    ata-WDC_WD200EDGZ-11BLDS0                            -      -      0     72      0  56.7M      -  189ms      -    7ms      -  672ns      -  185ms      -      -      -
logs                                                     -      -      -      -      -      -      -      -      -      -      -      -      -      -      -      -      -
  nvme-INTEL_SSDPEDMW400G4)18C400AGN-part1           1.60G  61.9G      0  1.95K      0   201M      -   85us      -   82us      -    1us      -      -      -      -      -
---------------------------------------------------  -----  -----  -----  -----  -----  -----  -----  -----  -----  -----  -----  -----  -----  -----  -----  -----  -----

I am no ZFS expert.

My understanding is that one can estimate the performance of a mirrors pool by multiplying the expected single disk performance by the quantity of mirrors. For example in your scenario- if one expects to write to a single disk (or 1 pair of mirrors) at a sequential write speed of ~140 MB/s, then one should expect a pool with 3 mirror vdevs to provide 420 MB/s sequential write speed. I think this would be quite a rough estimate.

What is your workload? It sounds like the 5.8GB is a singular file- not a directory of many small files? If it’s a singular file, I agree it sounds like the performance is a bit slow.

NFS would introduce another variable into the mix though. What is the performance like if you copy this file to the pool without transferring over the network? That may help to differentiate ZFS performance vs NFS performance

180 MB/sec, or 180Mbps? Those are not the same unit, and it’s not immediately clear which one you mean.

180 megabyte per second. I think this is the unit kde dolphin browser shows when transferring the file.

One other thing i would mention is that i have native encryption turned on (lz4).

You said this is over nfs. What kind of network do you have? If it’s simple 1Gbps ethernet, you’re bottlenecking on the network transport itself, not the storage system.

I have a 10 gigabit network. If i use async option with nfs the file transfer is pretty quick 1 gigabyte per second. The server has ample ram 256gb.

1 Like

I suspect you’re still seeing an issue more on the network side than the storage side. Can you run an fio command locally to check, please? I’d suggest this command, run from within the same directory you’ve been trying to access via nfs:

fio --name=random-write --ioengine=posixaio --rw=randwrite --bs=1M --numjobs=1 --size=4g --iodepth=1 --runtime=60 --time_based --fsync=1 --end_fsync=1

This will produce a stream of randomly written data for 60 seconds. The --fsync=1 argument forces them all to be sync writes. If we’re still seeing 180MiB/sec, we’ll want to look closer at your LOG vdev. If we suddenly see the speed shoot up to more like 300MiB/sec or higher, then we’re going to need to take a closer look at the network side of things.

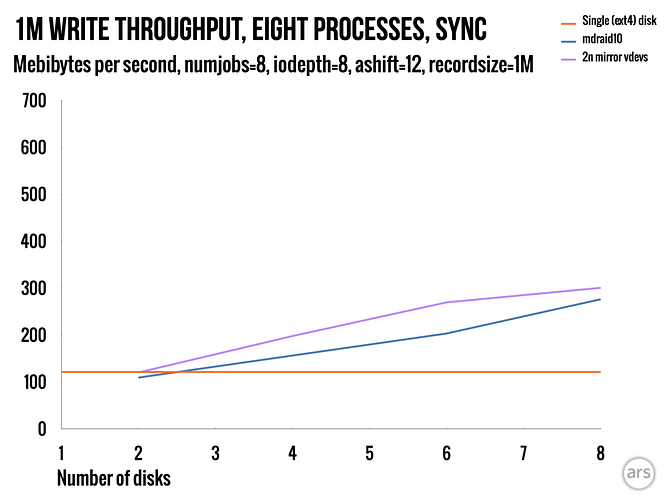
As a side note, 180MB/sec is a little low on what I’d expect for 1M sync write throughput with three rust mirrors and no SLOG. This chart shows fio random writes, 1M blocksize, to a pool of mirrors with one, two, three, and four total 2-way mirrors. At three mirrors (n=6), I saw about 300MiB/sec–this is on Ironwolf 12T drives, driven through an LSI 9300 HBA.

To be fair, some of the difference is likely that I was testing 8-process write, and you’re most likely running single-process with whatever you’re doing over NFS.

1 Like

Here is what i got running the test on the server.

$ fio --name=random-write --ioengine=posixaio --rw=randwrite --bs=1M --numjobs=1 --size=4g --iodepth=1 --runtime=60 --time_based --fsync=1 --end_fsync=1
random-write: (g=0): rw=randwrite, bs=(R) 1024KiB-1024KiB, (W) 1024KiB-1024KiB, (T) 1024KiB-1024KiB, ioengine=posixaio, iodepth=1
fio-3.37
Starting 1 process
random-write: Laying out IO file (1 file / 4096MiB)
Jobs: 1 (f=1): [w(1)][100.0%][w=543MiB/s][w=543 IOPS][eta 00m:00s]
random-write: (groupid=0, jobs=1): err= 0: pid=3353026: Thu Aug 29 21:46:29 2024
  write: IOPS=672, BW=672MiB/s (705MB/s)(39.4GiB/60002msec); 0 zone resets
    slat (usec): min=13, max=1978, avg=68.46, stdev=24.85
    clat (usec): min=141, max=285728, avg=765.33, stdev=1991.82
     lat (usec): min=169, max=285801, avg=833.79, stdev=1992.57
    clat percentiles (usec):
     |  1.00th=[  202],  5.00th=[  269], 10.00th=[  318], 20.00th=[  437],
     | 30.00th=[  553], 40.00th=[  627], 50.00th=[  709], 60.00th=[  791],
     | 70.00th=[  873], 80.00th=[  955], 90.00th=[ 1090], 95.00th=[ 1254],
     | 99.00th=[ 2802], 99.50th=[ 3163], 99.90th=[ 4228], 99.95th=[ 5014],
     | 99.99th=[83362]
   bw (  KiB/s): min=71680, max=884736, per=100.00%, avg=689018.55, stdev=138327.41, samples=119
   iops        : min=   70, max=  864, avg=672.85, stdev=135.12, samples=119
  lat (usec)   : 250=2.25%, 500=22.52%, 750=30.51%, 1000=28.49%
  lat (msec)   : 2=14.74%, 4=1.35%, 10=0.12%, 20=0.01%, 50=0.01%
  lat (msec)   : 100=0.01%, 250=0.01%, 500=0.01%
  fsync/fdatasync/sync_file_range:
    sync (usec): min=425, max=135463, avg=640.99, stdev=990.13
    sync percentiles (usec):
     |  1.00th=[  457],  5.00th=[  474], 10.00th=[  490], 20.00th=[  506],
     | 30.00th=[  523], 40.00th=[  537], 50.00th=[  553], 60.00th=[  570],
     | 70.00th=[  594], 80.00th=[  635], 90.00th=[  783], 95.00th=[ 1012],
     | 99.00th=[ 1631], 99.50th=[ 3032], 99.90th=[ 6325], 99.95th=[10290],
     | 99.99th=[34866]
  cpu          : usr=6.09%, sys=1.08%, ctx=80828, majf=14, minf=2920
  IO depths    : 1=200.0%, 2=0.0%, 4=0.0%, 8=0.0%, 16=0.0%, 32=0.0%, >=64=0.0%
     submit    : 0=0.0%, 4=100.0%, 8=0.0%, 16=0.0%, 32=0.0%, 64=0.0%, >=64=0.0%
     complete  : 0=0.0%, 4=100.0%, 8=0.0%, 16=0.0%, 32=0.0%, 64=0.0%, >=64=0.0%
     issued rwts: total=0,40327,0,40326 short=0,0,0,0 dropped=0,0,0,0
     latency   : target=0, window=0, percentile=100.00%, depth=1

Run status group 0 (all jobs):
  WRITE: bw=672MiB/s (705MB/s), 672MiB/s-672MiB/s (705MB/s-705MB/s), io=39.4GiB (42.3GB), run=60002-60002msec

For NFS i mount the filesystem on the client using:

In /etc/fstab
172.16.1.5:/home/user/stuff /home/user/stuff nfs _netdev,auto,x-systemd.automount,x-systemd.mount-timeout=10,timeo=14,x-systemd.idle-timeout=1min,rw,noatime,nodiratime,rsize=131072,wsize=131072,sync 0 0

I made an iperf3 test in the forward/reverse direction from the client.

$ iperf3 -c 172.16.1.5
Connecting to host 172.16.1.5, port 5201
[  5] local 172.16.1.28 port 51516 connected to 172.16.1.5 port 5201
[ ID] Interval           Transfer     Bitrate         Retr  Cwnd
[  5]   0.00-1.00   sec  1018 MBytes  8.53 Gbits/sec    0    404 KBytes       
[  5]   1.00-2.00   sec  1.09 GBytes  9.37 Gbits/sec    0    433 KBytes       
[  5]   2.00-3.00   sec  1.09 GBytes  9.37 Gbits/sec    0    430 KBytes       
[  5]   3.00-4.00   sec  1.09 GBytes  9.36 Gbits/sec    0    450 KBytes       
[  5]   4.00-5.00   sec  1.09 GBytes  9.35 Gbits/sec    0    410 KBytes       
[  5]   5.00-6.00   sec  1.09 GBytes  9.34 Gbits/sec    0    551 KBytes       
[  5]   6.00-7.00   sec  1.09 GBytes  9.37 Gbits/sec    0    407 KBytes       
[  5]   7.00-8.00   sec  1.09 GBytes  9.36 Gbits/sec    0    404 KBytes       
[  5]   8.00-9.00   sec  1.08 GBytes  9.32 Gbits/sec    0    410 KBytes       
[  5]   9.00-10.00  sec  1.09 GBytes  9.37 Gbits/sec    0    421 KBytes       
- - - - - - - - - - - - - - - - - - - - - - - - -
[ ID] Interval           Transfer     Bitrate         Retr
[  5]   0.00-10.00  sec  10.8 GBytes  9.28 Gbits/sec    0             sender
[  5]   0.00-10.00  sec  10.8 GBytes  9.27 Gbits/sec                  receiver

iperf Done.

$ iperf3 -c 172.16.1.5 -R
Connecting to host 172.16.1.5, port 5201
Reverse mode, remote host 172.16.1.5 is sending
[  5] local 172.16.1.28 port 59822 connected to 172.16.1.5 port 5201
[ ID] Interval           Transfer     Bitrate
[  5]   0.00-1.00   sec  1.04 GBytes  8.94 Gbits/sec                  
[  5]   1.00-2.00   sec  1.09 GBytes  9.37 Gbits/sec                  
[  5]   2.00-3.00   sec  1.09 GBytes  9.36 Gbits/sec                  
[  5]   3.00-4.00   sec  1.06 GBytes  9.09 Gbits/sec                  
[  5]   4.00-5.00   sec  1.07 GBytes  9.20 Gbits/sec                  
[  5]   5.00-6.00   sec  1.09 GBytes  9.35 Gbits/sec                  
[  5]   6.00-7.00   sec  1.09 GBytes  9.32 Gbits/sec                  
[  5]   7.00-8.00   sec  1.09 GBytes  9.34 Gbits/sec                  
[  5]   8.00-9.00   sec  1.09 GBytes  9.33 Gbits/sec                  
[  5]   9.00-10.00  sec  1.09 GBytes  9.36 Gbits/sec                  
- - - - - - - - - - - - - - - - - - - - - - - - -
[ ID] Interval           Transfer     Bitrate         Retr
[  5]   0.00-10.00  sec  10.8 GBytes  9.27 Gbits/sec    0             sender
[  5]   0.00-10.00  sec  10.8 GBytes  9.27 Gbits/sec                  receiver

Last test i did was to run on the client itself. i did a ‘cd’ to the directory nfs mounted on the client. A fio test showed again a drop in speed.

$ fio --name=random-write --ioengine=posixaio --rw=randwrite --bs=1M --numjobs=1 --size=4g --iodepth=1 --runtime=60 --time_based --fsync=1 --end_fsync=1
random-write: (g=0): rw=randwrite, bs=(R) 1024KiB-1024KiB, (W) 1024KiB-1024KiB, (T) 1024KiB-1024KiB, ioengine=posixaio, iodepth=1
fio-3.37
Starting 1 process
random-write: Laying out IO file (1 file / 4096MiB)
Jobs: 1 (f=1): [w(1)][100.0%][w=206MiB/s][w=206 IOPS][eta 00m:00s]
random-write: (groupid=0, jobs=1): err= 0: pid=434243: Thu Aug 29 21:56:24 2024
  write: IOPS=229, BW=229MiB/s (240MB/s)(13.4GiB/60001msec); 0 zone resets
    slat (usec): min=10, max=746, avg=48.47, stdev=25.22
    clat (usec): min=2043, max=32017, avg=4164.84, stdev=1645.62
     lat (usec): min=2067, max=32090, avg=4213.32, stdev=1663.24
    clat percentiles (usec):
     |  1.00th=[ 2180],  5.00th=[ 2311], 10.00th=[ 2409], 20.00th=[ 2606],
     | 30.00th=[ 2835], 40.00th=[ 3195], 50.00th=[ 3687], 60.00th=[ 4686],
     | 70.00th=[ 5473], 80.00th=[ 5735], 90.00th=[ 5997], 95.00th=[ 6325],
     | 99.00th=[ 7963], 99.50th=[ 9372], 99.90th=[15270], 99.95th=[18220],
     | 99.99th=[22676]
   bw (  KiB/s): min=75776, max=442368, per=100.00%, avg=234762.76, stdev=52626.82, samples=119
   iops        : min=   74, max=  432, avg=229.26, stdev=51.39, samples=119
  lat (msec)   : 4=53.25%, 10=46.35%, 20=0.38%, 50=0.02%
  fsync/fdatasync/sync_file_range:
    sync (usec): min=4, max=1069, avg=55.12, stdev=42.70
    sync percentiles (usec):
     |  1.00th=[    8],  5.00th=[   10], 10.00th=[   11], 20.00th=[   16],
     | 30.00th=[   25], 40.00th=[   38], 50.00th=[   47], 60.00th=[   57],
     | 70.00th=[   71], 80.00th=[   92], 90.00th=[  116], 95.00th=[  135],
     | 99.00th=[  155], 99.50th=[  159], 99.90th=[  314], 99.95th=[  375],
     | 99.99th=[  988]
  cpu          : usr=1.84%, sys=2.15%, ctx=27665, majf=15, minf=18
  IO depths    : 1=200.0%, 2=0.0%, 4=0.0%, 8=0.0%, 16=0.0%, 32=0.0%, >=64=0.0%
     submit    : 0=0.0%, 4=100.0%, 8=0.0%, 16=0.0%, 32=0.0%, 64=0.0%, >=64=0.0%
     complete  : 0=0.0%, 4=100.0%, 8=0.0%, 16=0.0%, 32=0.0%, 64=0.0%, >=64=0.0%
     issued rwts: total=0,13744,0,13744 short=0,0,0,0 dropped=0,0,0,0
     latency   : target=0, window=0, percentile=100.00%, depth=1

Run status group 0 (all jobs):
  WRITE: bw=229MiB/s (240MB/s), 229MiB/s-229MiB/s (240MB/s-240MB/s), io=13.4GiB (14.4GB), run=60001-60001msec
I ran fio again on the server and this timed monitored SLOG. This is what i get,

                                                       capacity     operations     bandwidth    total_wait     disk_wait    syncq_wait    asyncq_wait  scrub   trim  rebuild
pool                                                 alloc   free   read  write   read  write   read  write   read  write   read  write   read  write   wait   wait   wait
---------------------------------------------------  -----  -----  -----  -----  -----  -----  -----  -----  -----  -----  -----  -----  -----  -----  -----  -----  -----
tank                                                 5.40T  49.2T      0  7.58K      0  1.88G      -   54ms      -    7ms      -  977ns      -  298ms      -      -      -
  mirror-0                                           1.87T  16.3T      0    438      0   407M      -  365ms      -   43ms      -  816ns      -  341ms      -      -      -
    ata-WDC_WD201KFGX-68BKJN0                            -      -      0    221      0   205M      -  364ms      -   41ms      -  864ns      -  340ms      -      -      -
    ata-WDC_WD201KFGX-68BKJN0                            -      -      0    217      0   202M      -  367ms      -   46ms      -  768ns      -  342ms      -      -      -
  mirror-1                                           1.79T  16.4T      0    459      0   422M      -  351ms      -   42ms      -  720ns      -  338ms      -      -      -
    ata-ST20000NM007D-3DJ103                             -      -      0    233      0   214M      -  350ms      -   42ms      -  768ns      -  336ms      -      -      -
    ata-ST20000NM007D-3DJ103                             -      -      0    226      0   207M      -  352ms      -   41ms      -  672ns      -  339ms      -      -      -
  mirror-2                                           1.74T  16.4T      0    420      0   379M      -  239ms      -   46ms      -  720ns      -  210ms      -      -      -
    ata-ST20000NM007D-3DJ103                             -      -      0    208      0   185M      -  112ms      -   43ms      -  768ns      -   78ms      -      -      -
    ata-WDC_WD200EDGZ-11BLDS0                            -      -      0    212      0   194M      -  363ms      -   48ms      -  672ns      -  339ms      -      -      -
logs                                                     -      -      -      -      -      -      -      -      -      -      -      -      -      -      -      -      -
  nvme-INTEL_SSDPEDMW400G418C400AGN-part1            7.00G  56.5G      0  6.29K      0   719M      -  102us      -  101us      -  977ns      -      -      -      -      -
---------------------------------------------------  -----  -----  -----  -----  -----  -----  -----  -----  -----  -----  -----  -----  -----  -----  -----  -----  -----

OK, from here on out, we’re getting fairly speculative. What you’re seeing here is the effect of the additional latency introduced by the nfs client having to wait for the nfs server to acknowledge each write as synced before it moves on with its life. You might be able to improve on this with a better SLOG, but then again, you might not.

I quoted your SSD model because it doesn’t strike me as the best choice for a LOG vdev. The Intel 750 series is very long in the tooth, as NVMe drives go (first review on Anandtech showed up more than nine years ago) and was not designed for enterprise use. You might see significant improvement by updating to a lower latency drive… maybe. MAYBE. But I think, given those 100usec wait times, that it’s probably doing well enough with your current workload, even though it might fall flat on its face with a heavier one.

The way you can determine for certain is by temporarily doing zfs set sync=disable on the dataset you’re exposing via NFS. This will cause your machine to lie and INSTANTLY say “yep, safely committed to disk” as rapidly as it can, while the nfs client sends in the data. If you do this and the same fio run doesn’t change much, then you know you’re looking at a network latency bottleneck. If you do it and you get drastically improved results, then it might be worth shopping for a better LOG drive.

I am not recommending that you leave sync=disabled on, mind you. If you were considering doing that, you’re much better off just changing the NFS export to be async in the first place. (I do not have concrete advice to offer regarding the safety of asynchronous NFS. All I can tell you for certain is that you very rarely see that in production environments, which suggests that it might not be the safest thing to do, long term.)

I’m also mildly concerned by seeing a partition number on the LOG. Do you have anything else running on that drive? If so, that’s a REALLY bad idea; a LOG vdev should never, ever have any other job than just being a LOG vdev. :slight_smile:

I set sync=disabled on the dataset and ran fio again on the server,

Run status group 0 (all jobs):
  WRITE: bw=720MiB/s (755MB/s), 720MiB/s-720MiB/s (755MB/s-755MB/s), io=42.2GiB (45.3GB), run=60001-60001msec

So the result is the same as before.

The NFS file transfer hovered between 280-400 MBps. This surprised me as i thought with sync disabled i will get a gigabyte transfer like async. But that is not what happened.

So is this a network problem? If it is i dont know what else to use (i am a linux household and NFS seemed like the best choice).

Right, i did partition the SLOG initially since the internet said i need a small size for SLOG. However, i am not using any other partition. Maybe i should just use the whole disk.

Like I said… network latency issue. The way nfs sync works, even when you zfs set sync=disabled, is for every block of data sent over the wire, the client has to wait for the server to tell it “that block is now stored safely on disk.”

So even when you zfs set sync=disabled on the dataset that you’re exporting, you still have to pause to get acknowledgements throughout the transfer. That’s why even with sync=disabled, you’re still getting markedly lower throughput than when you tell nfs itself to use async mode. Your SLOG itself is adding roughly 100usec of latency to each of these operations, but the network itself adds, from the look of it, about the same amount again.

I do think you could get better performance with a better choice of LOG vdev, but you’re not going to be able to do better than you can do with sync=disabled. So the question is whether you’re happy enough with 180MiB/sec to let it ride, or whether you’re willing to buy a new device to replace your LOG vdev in order to land somewhere in between the 180MiB/sec you’re seeing now, and the 320-ish (average) MiB/sec you’re seeing when you disable sync on the ZFS side, but leave it on on the NFS side.

If I had to guess, my guess is that a dedicated higher-end LOG vdev–something like Intel Optane, although most sizes of that have been discontinued–would get you to somewhere around 240-280MiB/sec. What I’m not comfortable guessing is whether that’s enough of a delta that you’ll actually want to buy a different device, and I’m not judging you for it either way. :slight_smile:

So is this a network problem? If it is i dont know what else to use (i am a linux household and NFS seemed like the best choice).

Not a network problem, so much as a “this is how networks function” problem, from the look of it. Try SCP’ing the same file; if you get better results, given that you’re a linux household, you might want to consider just using sshfs instead of a separate NFS transport.

In general, you can expect sshfs (or scp) to use slightly more CPU firepower than nfs does, but without the latency hit you’re currently experiencing thanks to nfs using sync. Again, you could IN THEORY just use async nfs… but I am not actually, positively advising that, because I haven’t used it enough to have much familiarity for how likely it is to lead to corruption. All I know from that is secondhand reports that async nfs is rather risky. HOW risky, I really don’t know.

By contrast, sshfs is safe as houses IMO and IME.

You could also use Samba, which does not require sync… but I really do not recommend that in a Linux-only household; your Linux machines can access Samba shares just fine, but that protocol has its own performance dragons and they’re rather more complicated to troubleshoot. SMB is a very chatty protocol, and even though it isn’t technically sync, I suspect it would perform worse than what you’re seeing now, not better.

I tried with sshfs and as you anticipated got better speeds ~ 260Mib/s

Optane is not available locally where i live, but sourcing it from the US is definitely a possibility. I also have some SAS SSD HGST HUSMM8020ASS200 with me. Wonder if they are better than Intel 750.

The other possibility i was wondering about was the host operating system. Both the server and client are based on Archlinux. I would like to stick with Arch on the client, but open to changing on the server. I started initially with FreeNAS but wanted to run application too and felt FreeNAS was holding me back. Thereafter i moved to FreeBSD and used jails for a few years. All this while i was on RaidZ2 (with 6 disks), and never really tested the transfer speeds like now. Nvidia limitations on FreeBSD (and bhyve passthrough) pushed me to Linux and i now run LXD/Incus and Docker containers (no vm’s though).

TLDR; Will changing the server to another linux flavor like Debian or FreeBSD help with NFS transfer?

I’d be very surprised if they did. It might be worth trying booting from a FreeBSD live CD, importing your pool, and spinning up an nfs export from it for long enough to test, though, just in case. I don’t think it’s likely at all that a different Linux distro would be an improvement over Arch in that respect, but it’s at least possible that FreeBSD has a more performant nfs stack than Linux does.

I wouldn’t want to reinstall the whole server to test that, but just booting up in a live environment doesn’t seem like it would be too painful to try. Then if it DOES offer significant improvements, you can consider whether you want to migrate back or not, and you know what you are or aren’t getting if you do.

Still might be simpler just to go with sshfs, since it’s already hitting the target I estimated you might manage with nfs + a much lower latency LOG vdev than the one you currently have. Same benefits, no expense, and no risk since you already know the result.

Right, maybe sticking with sshs is the path of least resistance. One question still on my mind is difference in results between sshfs and fio tests. There is a speed drop of about half with sshfs.

Is sshfs 260 MiB/s a more realistic number with 3 x mirror pool, and fio is reporting better due to some caching?

sshfs simply isn’t as high performance as NFS, largely because it’s fully encrypted, which NFS is not. it doesn’t matter at 1Gbps, but at 10Gbps, everything is potentially a bottleneck, in part because you’re heavily reliant on the maximum performance your CPU can offer on a single thread.

You may be able to get considerably better performance out of a different SSH cipher than the one being negotiated by default. This might be worth experimenting with. In the past, I’ve had great results taking SSH off AES-NI ciphers and substituting chacha20… but then most processors started adding hardware acceleration for AES-NI, which reverses that trend in its tracks, but only on those processors.

Which is a long winded way of saying if this really bothers you and you really need to eke out more speed than you’re managing so far, you might want to try playing with ciphers… but I can’t just tell you “try this one specifically,” you’ll have to do the playing yourself.

Another thing that might be worth realizing: you really are only looking at the limits of a single CPU thread here. If you have multiple operations going on at the same time, each is going to get its own CPU thread, so your total throughput capacity across multiple users will be MUCH closer to the maximum throughput you were seeing from the storage itself, when making fio runs.

With sshfs, I believe every concurrent operation, even from the same user on the same client system, winds up being handled on a separate CPU hardware thread–but you’ll want to verify me on that before you rely on it. The connections from two separate users, even if the two are on the same host machine, will definitely wind up on two separate CPU threads no matter what. This is where that idea of total throughput being a lot higher than single-file throughput comes in from. That might also be worth thinking about before you tear your hair out over “lost” performance. :slight_smile:

1 Like