I’m running an ubuntu VM running Gitlab inside docker. The VM is running zfs-2.2.2-0ubuntu9.1 for the docker container (root is ext4/lvm on a different virtual disk).
(why zfs inside the VM instead of the host? Well, I want zfs, and the host is Windows Hyper-V, and I don’t have influence over that )
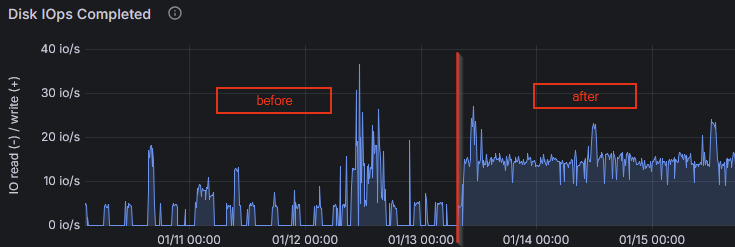
I found that starting a bit over a week ago, the virtual disk containing the zfs pool started to have constantly “high” idle IOPS, i.e. the baseline jumped from 0 IOPS to about 15 IOPS, resulting in a baseline data write rate of about 250kB/s:
There is no scrub in progress (and the last one finished successfully a few days earlier).
iostat showed that the writes came in bursts of about 1MiB every 5 seconds. iotop showed that there was no process writing that much data.
with lttng I identified the kernel thread z_wr_int which seems to be responsible for that.
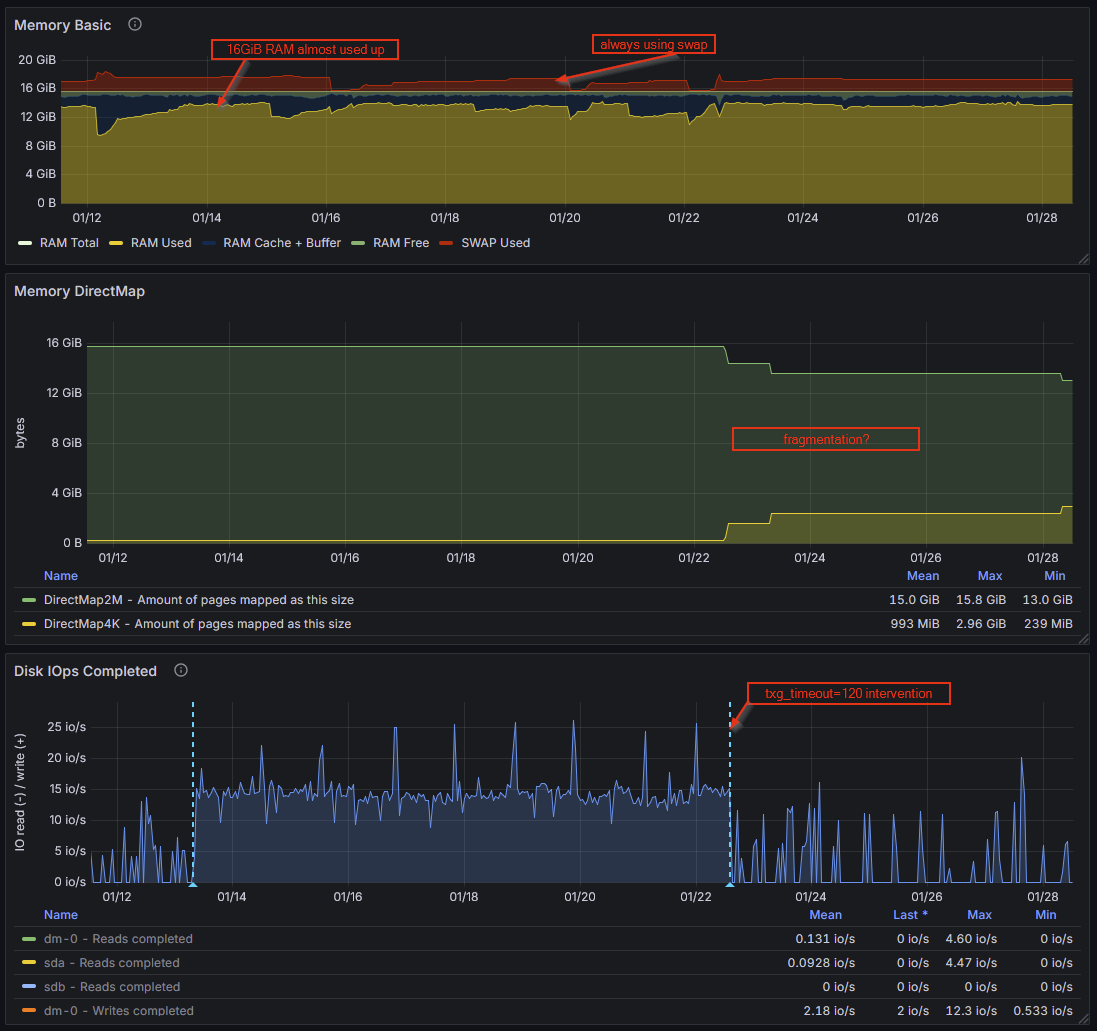
The 5 seconds burst interval is due to zfs_txg_timeout=5. After changing that to something higher (120), the write rate was back to something normal-looking (baseline of 0 IOPS, and no huge 24MiB bursts every 120seconds, so it’s not like it just accumulated all the data over longer period).
While this solved the IOPS issue, I’d still like to find out the root cause. From my understanding, this seems to be related to metadata changes, when I can’t find related write syscalls? How can I find out where those metadata changes come from? I can’t correlate the write bursts to any syscalls when the writes are first accumulated over a few seconds before appearing in a trace.
P.S.: I also started the usual investigation of “what did I do to it at that point in time”, but “increasing the graphql query timeout to 2 seconds” doesn’t seem related, when the IOPS are pretty constant no matter if any queries are coming in or not. And there is no log volume increase in that time window.
Looks like an artifact from bad caching on the host side IMO. I can’t give you any more direct advice than that, because I don’t have much experience at all with ZFS beneath HyperV.
There is also a possibility that the underlying physical storage crossed some fragmentation threshold recently. ZFS normally manages that kind of issue itself, using metaslabs to maintain zones of continuous or nearly contiguous free space.
But with ZFS crammed under HyperV… How did you create the storage for it? Are you feeding in raw disks, or are you using sparse files under NTFS, or…?
I “created the storage” by asking for an Ubuntu VM so I’d have to ask the responsible person for the host system, which will take till monday.
Apart from that, can you help me understand the host-side impact better? I have to mention that the IOPS measurements (also those from the screenshots) are all from inside the VM.
I thought the VM would not be aware of “host-side IOPS”, and could only see I/O that originates from inside the VM.
Is there any way a virtual device could trigger the guest OS’ zfs to issue writes to it?
I think the thing you’re misunderstanding is that if the host blocks on storage, the guest does also. ZFS expects to be seeing bare metal underneath, and tunables like the write delay you adjusted are designed for that.
When you have two nested caching algorithms, neither of which is aware of the other and one of which can’t even see what’s going on with the actual storage, you can end up with a nasty situation where the inner cache feeds the outer cache just enough information to fill it–but not enough to REfill it–so you’re essentially doubling cache latency issues.
When you adjusted your write interval WAAAAAAY out, what you were essentially doing is causing ZFS to wait to dump the cache until it could KEEP filling the host’s cache repeatedly. This lessens the frequency of the multiple-cache-latency spikes, but doesn’t really fix it.
After some further investigation, could memory pressure and/or fragmentation lead to such I/O behaviour? I found via /proc/buddyinfo that there are no “Normal” pages available at sizes 128k and above. I also saw in my metrics that after I changed the txg_timeout to 120s, the DirectMap4k pages went up and DirectMap2M went down.
For the /proc/buddyinfo values, I don’t have the history
RAM usage is constantly high thanks to gitlab being a memory hog.
Should be easy enough to figure out: limit the RAM available to your Gitlab stack (inside the guest; DON’T decrease the RAM allocation to the guest as a whole) and see if things improve or worsen.
If you’re under that much memory pressure inside the guest… is the guest dipping into swap? Because that will ABSOLUTELY murder performance, including storage performance.
Is the host itself under a lot of memory pressure? If so, see above regarding swap, only this time, it’s about hitting the pagefile on your HyperV host, and the thing to try will be decreasing RAM allocation to the guest(s) from the host side.