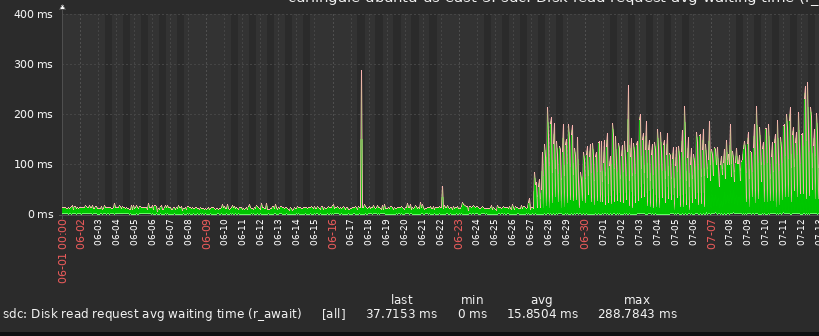
Hi all, I am looking for a bit of troubleshooting guidance for (what is now) a fairly longstanding alert for excessive read latency on disks underlying a zfs mirror. I’ll preface this by saying that file systems and related topics are not something I’ve delved into and I have done little of this type of troubleshooting in the past, so I am likely missing some of the basics.
The hardware
I have a $5 Linode running a single service (Snikket) as a Docker container. Only family members use this service, so it sees very light traffic.
I added two block volumes to the vps, created a zfs volume and dataset, then moved the docker volumes to this dataset (so I can leverage zfs snapshots, etc.), as follows:
sudo apt install zfsutils-linux
sudo zpool create -f docker-pool mirror /dev/disk/by-id/disk-a /dev/disk/by-id/disk-b
sudo zfs create docker-pool/volumes
I have a Zabbix server for monitoring and an agent installed on this node.
The issue
I’ve had this node running for several months without issue. A couple months ago, at this point, I started getting an extremely annoying flapping alert for the “disk read request average waiting time (r_await).” I’ve fixed the flapping but not the large increase in wait time:
This screenshot is of just one of the block storage devices, but both report similar latency.
What (little) I’ve done so far
I haven’t spent much time on this issue, mostly because I didn’t know where to start. A bit of googling brought me to this article on using zpool iostat.
$ zpool iostat -vl
                                         capacity     operations     bandwidth    total_wait     disk_wait    syncq_wait    asyncq_wait  scrub   trim
pool                                   alloc   free   read  write   read  write   read  write   read  write   read  write   read  write   wait   wait
-------------------------------------  -----  -----  -----  -----  -----  -----  -----  -----  -----  -----  -----  -----  -----  -----  -----  -----
docker-pool                            4.19G  5.31G      4     84  36.4K   560K    2ms  914us    2ms  218us    5us    1us  375us  726us   53ms      -
  mirror-0                             4.19G  5.31G      4     84  36.4K   560K    2ms  914us    2ms  218us    5us    1us  375us  726us   53ms      -
    scsi-0Linode_Volume_docker-data-1      -      -      2     42  18.7K   280K    2ms  922us    2ms  220us    5us    1us  458us  731us   55ms      -
    scsi-0Linode_Volume_docker-data-2      -      -      2     42  17.7K   280K    2ms  907us    2ms  215us    6us  843ns  302us  721us   50ms      -
-------------------------------------  -----  -----  -----  -----  -----  -----  -----  -----  -----  -----  -----  -----  -----  -----  -----  -----
iostat -x returns:
Linux 5.15.0-116-generic (localhost)    08/18/2024      _x86_64_        (1 CPU)

avg-cpu:  %user   %nice %system %iowait  %steal   %idle
           3.21    0.01    6.47    3.82    0.08   86.41

Device            r/s     rkB/s   rrqm/s  %rrqm r_await rareq-sz     w/s     wkB/s   wrqm/s  %wrqm w_await wareq-sz     d/s     dkB/s   drqm/s  %drqm d_await dareq-sz     f/s f_await  aqu-sz  %util
loop0            0.00      0.00     0.00   0.00    0.17     3.11    0.00      0.00     0.00   0.00    0.00     0.00    0.00      0.00     0.00   0.00    0.00     0.00    0.00    0.00    0.00   0.00
loop1            0.00      0.09     0.00   0.00    0.44    33.76    0.00      0.00     0.00   0.00    0.00     0.00    0.00      0.00     0.00   0.00    0.00     0.00    0.00    0.00    0.00   0.00
loop2            0.00      0.00     0.00   0.00    0.17     6.12    0.00      0.00     0.00   0.00    0.00     0.00    0.00      0.00     0.00   0.00    0.00     0.00    0.00    0.00    0.00   0.00
loop3            0.00      0.00     0.00   0.00    0.56    15.86    0.00      0.00     0.00   0.00    0.00     0.00    0.00      0.00     0.00   0.00    0.00     0.00    0.00    0.00    0.00   0.00
loop4            0.00      0.00     0.00   0.00    0.22     3.05    0.00      0.00     0.00   0.00    0.00     0.00    0.00      0.00     0.00   0.00    0.00     0.00    0.00    0.00    0.00   0.00
loop5            0.03      0.25     0.00   0.00    0.10     7.24    0.00      0.00     0.00   0.00    0.00     0.00    0.00      0.00     0.00   0.00    0.00     0.00    0.00    0.00    0.00   0.00
loop6            0.00      0.00     0.00   0.00    0.13     5.97    0.00      0.00     0.00   0.00    0.00     0.00    0.00      0.00     0.00   0.00    0.00     0.00    0.00    0.00    0.00   0.00
loop7            0.00      0.00     0.00   0.00    0.20     6.14    0.00      0.00     0.00   0.00    0.00     0.00    0.00      0.00     0.00   0.00    0.00     0.00    0.00    0.00    0.00   0.00
loop8            0.00      0.00     0.00   0.00    0.00     1.00    0.00      0.00     0.00   0.00    0.00     0.00    0.00      0.00     0.00   0.00    0.00     0.00    0.00    0.00    0.00   0.00
sda              3.05     85.98     0.26   7.74    0.42    28.18    4.98     32.23     1.19  19.35    0.35     6.47    0.01     19.24     0.00   0.00    0.04  1403.62    0.47    0.12    0.00   0.42
sdb              1.20      6.17     0.34  22.02    0.24     5.13    0.36      5.48     1.01  73.64    2.31    15.18    0.00      0.00     0.00   0.00    0.00     0.00    0.00    0.00    0.00   0.12
sdc              3.23     18.73     0.00   0.00   10.87     5.79   42.46    280.07     0.00   0.00    0.14     6.60    0.00      0.00     0.00   0.00    0.00     0.00    0.98   30.73    0.07   4.39
sdd              3.57     17.69     0.00   0.00   10.10     4.96   42.41    280.07     0.00   0.00    0.14     6.60    0.00      0.00     0.00   0.00    0.00     0.00    0.98   30.94    0.07   4.51
Right now may not be the best example of the issue because things are pretty quiet, but I’m writing this now and it might be another couple months before I tackle it again, if I don’t finish it…
Even with the relatively low r_await from iostat, it’s still 5x higher than the total_wait for reads in zpool iostat; this disparity (if not the exact magnitude) has held true when r_await is much higher. My assumption is that these two measures would be related, but perhaps I’m mistaken.
Any pointers on additional steps to take are welcome. Thanks.
